Roland KesziArtificial Intelligence &
Data Science Portfolio

On these pages I share the results of some of my data science and artificial intelligence based analysis projects.

Pages for higher education ↗

← All projects

US airline tweets: sentiment dashboard and lexicon evaluation

How do passengers talk about airlines on social media, and how well can a dictionary-based tool read their mood? An interactive dashboard and an evaluation of the VADER sentiment lexicon against human labels.

Data
14,640 labelled tweets about six US airlines, February 2015
Methods
Exploratory analysis, VADER sentiment scoring, confusion-matrix evaluation
Tools
Python, Streamlit, Plotly, NLTK

The data

The Twitter US Airline Sentiment dataset contains 14,640 tweets about six US airlines. Human annotators labelled each tweet as positive, neutral or negative and tagged the reason for each complaint.

An interactive dashboard

I built a Streamlit dashboard for exploring the data. It works in English and Hungarian, and its filters for airline, sentiment and hour of day apply to every view. It covers the sentiment split per airline, a complaint profile, time patterns, word clouds and a downloadable data table.

Sentiment split of tweets by airline
63% of all tweets are negative. US Airways, American and United draw the most criticism, and customer service is the most common complaint.

→ Open the live dashboard (it may take about 30 seconds to wake up)

Can a lexicon read passengers' mood?

VADER (Valence Aware Dictionary and sEntiment Reasoner, part of NLTK) was designed for social media text. It handles slang, emoticons, capital letters and punctuation, and it accounts for intensifiers ("very good") and dampeners ("slightly bad"). It needs no training. I compared its predictions with the human labels on all 14,640 tweets.
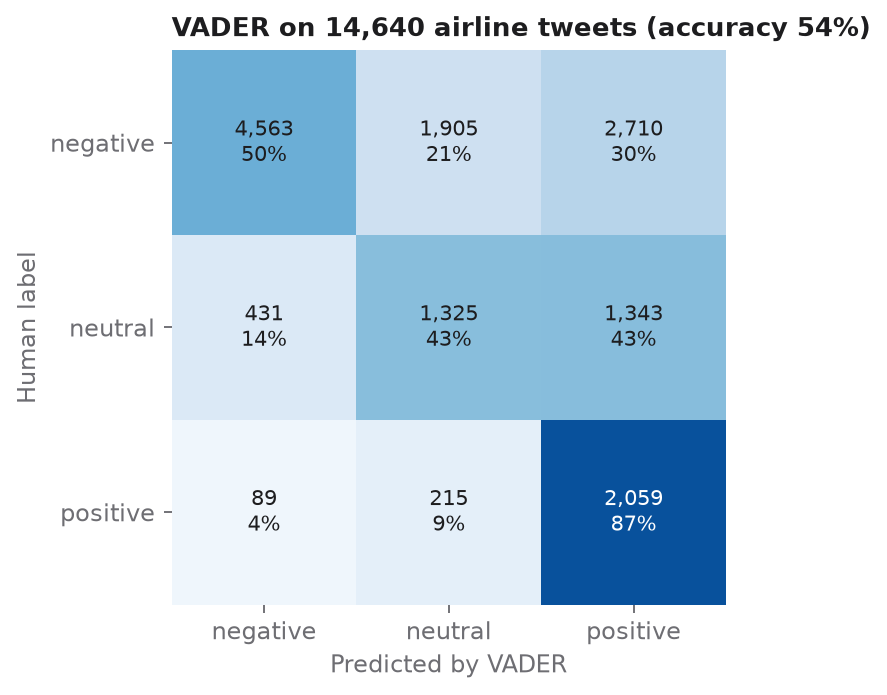
Confusion matrix of VADER predictions against human labels
VADER reaches an accuracy of 54%. When it says "negative" it is almost always right (precision 0.90), but it catches only half of the negative tweets (recall 0.50).
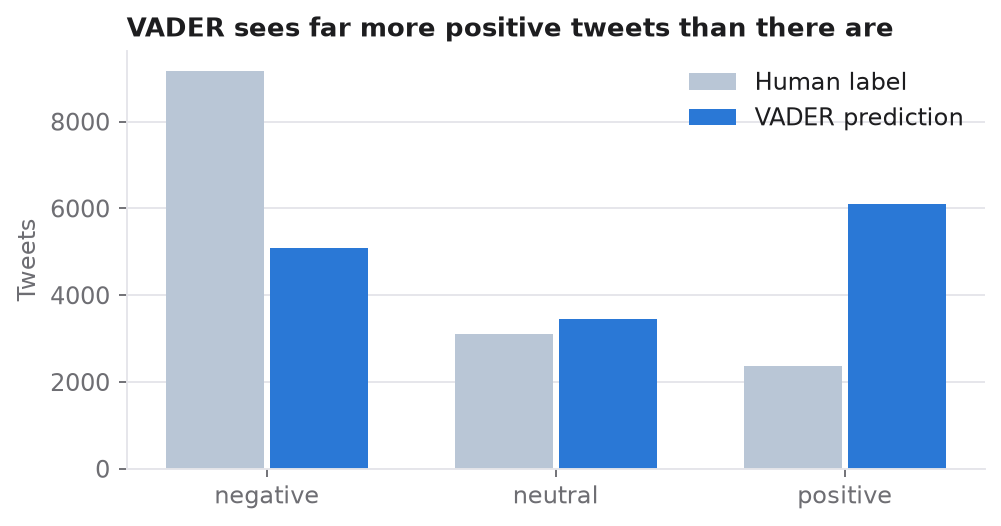
Predicted versus actual number of tweets per sentiment
VADER labels 6,112 tweets positive, but only 2,363 are. 2,710 of the negative tweets are scored as positive.

Conclusions

Social media complaints are dominated by service issues, and an interactive dashboard makes the patterns easy to explore by airline and time of day. A dictionary-based tool like VADER is fast and needs no training, but on real customer complaints it misses half of the negative messages and over-predicts positive ones, because a word list cannot read context such as sarcasm or polite phrasing in an angry message. This is the gap that the LLM benchmark shows modern language models closing.

→ Code on GitHub

Data: Twitter US Airline Sentiment (Crowdflower / Kaggle). Reference: Hutto, C. J., & Gilbert, E. (2014). VADER: a parsimonious rule-based model for sentiment analysis of social media text. ICWSM.